1 Introduction
Metal materials are widely used in many industrial and everyday applications, but they are susceptible to corrosion in certain environments, which can reduce their performance and lifespan. To improve the corrosion resistance of metal materials, corrosion-resistant coatings are widely applied to their surfaces [1, 2, 3, 4].
A corrosion-resistant coating is a thin film formed on the surface of a metal, designed to provide an additional protective layer [5, 6]. Common types of surface corrosion-resistant coatings include electroplating, spraying, chemical vapor deposition, and physical vapor deposition, each with its own specific advantages and application scope [7, 8]. For example, electroplated coatings offer high corrosion resistance and decorative properties, while physical vapor deposition provides highly uniform and dense coatings [9, 10]. Surface corrosion-resistant coatings significantly influence the corrosion resistance of metallic materials [11]. On one hand, these coatings act as a barrier layer, isolating the metal from environmental contact and reducing corrosion [12, 13]. On the other hand, they can alter the surface chemical properties of metallic materials, enhancing their corrosion resistance [14, 15]. This is because some surface coatings exhibit high corrosion resistance, oxidation resistance, and wear resistance [16]. The corrosion resistance of surface corrosion-resistant coatings is influenced by the type of metal material and the adhesion strength of the coating [17]. Coating adhesion involves the bond strength between the organic coating and the metal substrate surface, as well as the coating’s internal cohesive strength [18, 19]. These two forces interact, not only affecting the coating’s ability to effectively block external corrosion factors from attacking the metal, but also determining the coating’s protective effect on the metal [20, 21]. If the coating cannot firmly adhere to the metal surface, its protective effect will be significantly reduced. Insufficient cohesive strength of the coating may lead to cracking of the paint film, thereby losing its protective function [22, 23, 24].
Petrunin [25] highlights the numerous advantages of metals, pointing out that metals face a serious and unavoidable issue: corrosion caused by environmental influences. It emphasizes the efforts made by humanity to address metal corrosion and discusses the research progress in metal corrosion-resistant polymers and coating materials, including preparation, adhesion, and application. Son et al. [26] developed a protective coating composed of reduced graphene oxide/graphene oxide, which exhibits excellent corrosion resistance and adhesion, providing a feasible approach for using graphene coatings to protect metal surfaces from corrosion. Verma et al. [27] describes the application of polymers as coating materials, reviews solvent evaporation mechanisms and cross-linking film formation mechanisms, and discusses the application of polymer coatings in biomedical and metal fields, emphasizing that corrosion resistance is a key aspect of metal polymer coatings. Deryushev et al. [28] examines the experimental quality analysis issues of typical corrosion-resistant coatings designed for metal structures operating under harsh environmental conditions, and suggests using adhesion, thickness, and weather resistance as quality indicators for coatings. Titu, Ravai-Nagy and Pop [29] highlights that the adhesion of corrosion-resistant coatings is one of the critical factors ensuring the service life and strength of aluminum alloys in industrial applications. It analyzes the influence of coating processes on the adhesion of corrosion-resistant coatings for aluminum alloys, emphasizing the importance of selecting the optimal coating process to enhance adhesion and durability under corrosive conditions. Fan et al. [30] highlights that laser surface texturing and micro-arc oxidation technologies provide effective methods for improving the adhesion and corrosion resistance of aluminum alloy bonding interfaces, and these technologies can be applied to the automotive lightweighting field. Rezaei Abadchi et al. [31] used an acrylic coating containing titanium dioxide, zinc phosphate, and benzophenone to improve the corrosion resistance and UV resistance of steel structures. The coating was characterized based on dynamic polarization and adhesion, among other factors. The results indicated that the acrylic samples exhibited poor corrosion resistance and UV resistance. Yu et al. [32] addresses the severe corrosion issues of metal structures in southern coastal regions of China by proposing an improved YOLOv5-GOLD-NWD model and constructing a database for metal surface corrosion under different protective coatings. The model demonstrates high accuracy in detecting and identifying metal corrosion, providing a reference for enhancing corrosion protection of steel structures in coastal areas. Savignac et al. [33] points out that corrosion is a serious issue faced by various metals. Based on this, a mixed sol-gel layer was deposited to enhance the corrosion resistance and adhesion of the zinc phosphating substrate. After multiple investigations and the addition of new precursors under specific conditions, the optimal formulation and performance of the system were obtained.
This paper first provides a detailed description of the origin and preparation process of the experimental materials, and outlines the sample processing procedures provided by the manufacturer. A comprehensive adhesion testing method is proposed, encompassing control of environmental parameters such as temperature and humidity. Multiple characterization techniques are employed to design a systematic corrosion resistance testing protocol. The conventional properties of the samples are studied, with the coating structure characterized using infrared absorption spectroscopy and hydrogen nuclear magnetic resonance spectroscopy. Based on the results of water absorption rate and wet adhesion tests, the performance differences between different coatings are analyzed. For the X1 coating with the optimal comprehensive performance, polarization curves and AC impedance spectroscopy tests are used to reveal its protective mechanism.
2 Experimental design for adhesion and corrosion resistance of anti-corrosion coatings
Long-term protection of metal materials in corrosive environments is a key issue in the industrial field. The adhesion and corrosion resistance of anti-corrosion coatings directly determine their engineering applicability. This paper takes a steel structure engineering project as a background and compares the performance differences of three water-based epoxy coatings.
2.1 Experimental materials
2.1.1 On-site coating samples
A steel structure project is located in City A. The project includes steel columns, beams, braces, and other steel structure components. The steel structure components are connected by welding and bolts.
The anti-corrosion coating of the steel structure components consists of a coat of gray water-based epoxy zinc-rich primer and a coat of gray water-based epoxy micaceous iron oxide intermediate paint.
2.1.2 Factory provides samples
Based on the information regarding the corrosion-resistant coatings used for steel structure components, one type of water-based epoxy zinc-rich primer with the same specifications and model number was obtained from a certain manufacturer, with the sample number designated as X3. Based on the information regarding the corrosion-resistant coatings used for steel structure components, one type of water-based epoxy micaceous iron oxide intermediate coating with the same specifications and model number was obtained from a certain manufacturer, with the sample number designated as X2. According to the manufacturer’s description, X2 is a product with lower strength but better flexibility. The manufacturer also provided a water-based epoxy micaceous iron oxide intermediate coating with higher strength for comparison, with sample number X1. The sample information for the three corrosion-resistant coatings is shown in Table 1. The adhesion substrate was a sandblasted steel plate measuring 200mm \(\mathrm{\times}\) 85mm \(\mathrm{\times}\) 6mm; the surface cleanliness was Sa2½ grade, and the surface roughness was medium (G) grade.
| Sample number | Sample ratio(w/w) (Main paint: Curing agent) | The color of each component | Paint film color |
| X1 | 25:6 | The main paint is grey and the curing agent is yellow | Grey |
| X2 | 22:3 | The main paint is medium gray and the curing agent is white | Medium grey |
| X3 | 23:4 | The main paint is grayish red and the curing agent is yellow | Grayish red |
The water-based zinc-rich primer was mixed uniformly according to the product’s specified component ratio and left to cure for the specified time before application. Unless otherwise specified, the curing time for the water-based zinc-rich primer is 25 minutes. The application requirements for the water-based epoxy zinc-rich primer are one or two coats, with an 18-hour interval between coats when applying two coats, and a total dry film thickness of (85\(\mathrm{\pm}\)20) \(\mu\)m. The test panels were cured under specified conditions [temperature (22\(\mathrm{\pm}\)4)\(\mathrm{{}^\circ}\)C, relative humidity (46\(\mathrm{\pm}\)7)%] for 5 days before testing.
The components of the water-based epoxy micaceous iron oxide intermediate coat are mixed in the specified proportions, cured for 25 minutes at 22\(\mathrm{{}^\circ}\)C \(\mathrm{\pm}\) 4\(\mathrm{{}^\circ}\)C, and then applied to the test panel. The coating requirements for the water-based epoxy micaceous iron oxide intermediate coat are a film thickness of (80–120) \(\mu\)m, with 1–2 coats applied by spraying or brushing, each coat spaced 18 hours apart. The test panels are cured under constant temperature and humidity conditions [temperature (22\(\mathrm{\pm}\)4)\(\mathrm{{}^\circ}\)C, relative humidity (46\(\mathrm{\pm}\)7)%] for 5 days before inspection.
2.2 Adhesion test
Test environment, test equipment, and test procedures are as follows:
Test environment. Temperature (22, 60, 100) \(\mathrm{{}^\circ}\)C, relative humidity (46 \(\mathrm{\pm}\) 7)%.
Tensile testing machine. Electronic universal testing machine with a range of 0–75 kN, accuracy grade 0.1, and tensile speed not exceeding 1.5 MPa/s.
Test columns. Steel cylindrical bodies with a diameter of 25 mm and a height of 50 mm. One end of the test column has a hard, flat surface bonded with adhesive/coating, with its plane perpendicular to the axis of the test column, while the other end is equipped with a device for connecting to the tensile testing machine.
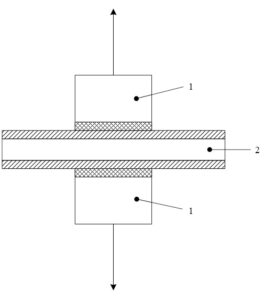
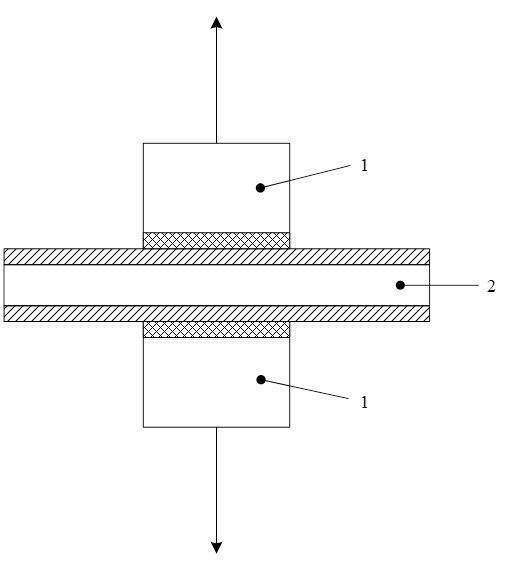
Test procedure. A universal test method applicable to both hard and deformable substrates is used (using two test columns). The adhesive is uniformly applied to the surfaces of two clean, identical-diameter test columns. The test specimen is placed between the two adhesive-coated surfaces of the test columns, with the columns centered and coaxially aligned relative to the specimen. The test assembly for a sandwich test on a double-coated substrate is shown in Figure 1, where “1” denotes the test column coated with adhesive and “2” denotes the double-coated substrate.
The test assembly is placed in a centering device and maintained in a coaxial arrangement during the adhesive curing period. After curing, use a cutting device to cut through the test columns along their circumferential lines to the substrate. Place the test assembly in a centering device and maintain the coaxial alignment during the adhesive curing period. After curing, use a cutting device to cut through the test columns along their circumferential lines to the substrate. Place the test assembly in a tensile testing machine, carefully center the test columns to ensure that the tensile force is uniformly applied to the test area without any twisting. Apply tensile stress perpendicular to the painted substrate plane, increasing the stress at a rate not exceeding 1.5 MPa/s. The failure of the test assembly should occur within 75 seconds of stress application. Record the tensile force at failure. Conduct at least seven measurements, using at least seven test assemblies.
2.3 Characterization methods and instruments
2.3.1 X-ray powder diffractometer
X-ray diffractometers (XRD) are used to determine the phase composition and crystallinity of samples. The testing procedure is as follows: first, the solid sample is ground into a uniform fine powder, then placed on the sample stage, and pressed flat with a glass slide. The target material used for testing is a Cu target, with an incident beam wavelength of \(\lambda =0.154056nm\), a test voltage of 55 kV, a test current of 55 mA, a test range of 5\(\mathrm{{}^\circ}\)–100\(\mathrm{{}^\circ}\), and a scanning rate of 8\(\mathrm{{}^\circ}\)/min.
2.3.2 Fourier Transform Infrared Spectrometer (FT-IR)
The Fourier Transform Infrared Spectrometer (FT-IR) is used to determine functional groups and chemical bonds in samples. The wavenumber range tested in this paper is 500–5000 cm\(^{-1}\).
2.3.3 X-ray Photoelectron Spectrometer (XPS)
The X-ray Photoelectron Spectrometer (XPS) is used to analyze the elemental composition and bonding state of samples. The instrument used in this study is a specific model produced by a U.S. company.
2.3.4 Field Emission Scanning Electron Microscope (SEM)
The scanning electron microscope (SEM) is used to analyze the microscopic morphology of samples. The instrument used in this study is a specific model produced by a U.S. company, with a parameter voltage of 20 kV. The testing procedure is as follows: a small amount of sample is first adhered to conductive adhesive on the sample stage, then placed in the testing chamber of the electron microscope for testing under vacuum conditions.
2.3.5 Transmission electron microscope (TEM)
The transmission electron microscope (TEM) is used to analyze the microscopic morphology and structure of samples. The model used in this study is produced by a Japanese electronics company. The specific testing steps are as follows: First, the powder sample is ultrasonically dispersed in anhydrous ethanol solution. A small amount of the dispersed solution is added to a copper grid, allowed to dry, and then placed in the sample chamber. After vacuuming, the test is conducted.
2.4 Corrosion resistance study
2.4.1 Electrochemical testing and analysis
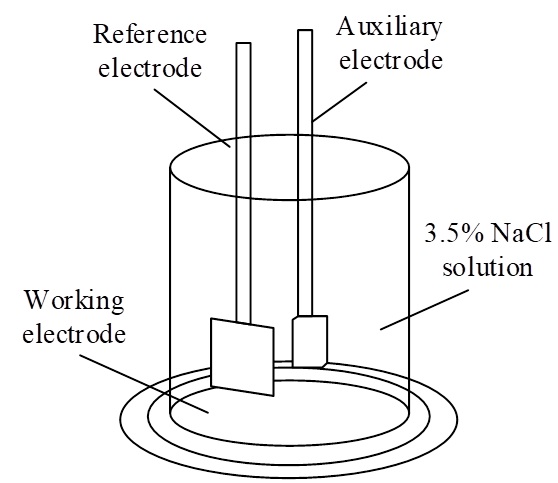
Electrochemical testing primarily includes open-circuit potential testing, electrochemical impedance spectroscopy testing, and dynamic potential polarization curve testing. This paper uses an electrochemical workstation of a certain model produced by a certain company for electrochemical testing. The electrochemical experiments were conducted using a three-electrode system, whose structure is shown in Figure 2, consisting of a working electrode (WE), a reference electrode (RE), and an auxiliary electrode (AE). The WE is a Q345 low-carbon steel plate coated with a coating, with an exposed area of 0.8 cm² during testing. The RE is a saturated calomel electrode (SCE), and the AE is a platinum sheet electrode. The electrolyte is a 4.3 wt% NaCl solution.
1) Open-circuit potential (OCP) testing. Open-circuit potential (OCP) reflects the extent of corrosion tendency and is one of the key methods for analyzing the corrosion resistance of coatings. Before testing OCP, the steel plate coated with the coating should be immersed in a NaCl solution for a certain period of time. Once the system has stabilized, the test should be conducted, and the change curve of OCP with increasing immersion time should be recorded. Each sample group should undergo three tests to ensure the reliability of the experimental results.
2) Electrochemical impedance spectroscopy (EIS) testing. EIS is an important research method for analyzing the corrosion resistance of anti-corrosion coatings, as it reflects the corrosion behavior occurring within the coating. Before conducting EIS testing, the OCP curve as a function of time should be measured. Once the OCP has stabilized, EIS testing should be performed at that OCP value. The amplitude of the sinusoidal voltage signal is 30 mV, and the testing frequency range is 10\(^{-2}\) Hz to 10\(^{5}\) Hz. EIS test results include Nyquist plots and Bode plots. The test results are fitted using ZView software, and an appropriate equivalent circuit is selected based on the test results to obtain relevant electrochemical parameters.
3) Dynamic polarization curve testing. Tafel polarization curves are typically measured at the end of the immersion process and after other electrochemical tests have been completed. The Tafel curve is measured at a scan rate of \(1.5{\rm mVs}^{-1}\) within the range of -220 mV to 220 mV near the open-circuit potential (OCP). The Tafel extrapolation method, as shown in Figure 3, is used to calculate the dynamic potential polarization parameters, including the anodic slope \(\left(b_{a} \right)\), cathodic slope \(\left(b_{c} \right)\), corrosion potential \(\left(E_{corr} \right)\), and corrosion current density \(\left(i_{corr} \right)\). The polarization resistance \(\left(R_{p} \right)\) and protection efficiency \(\left(PE\right)\) are calculated using Eqs. (1) and (2).
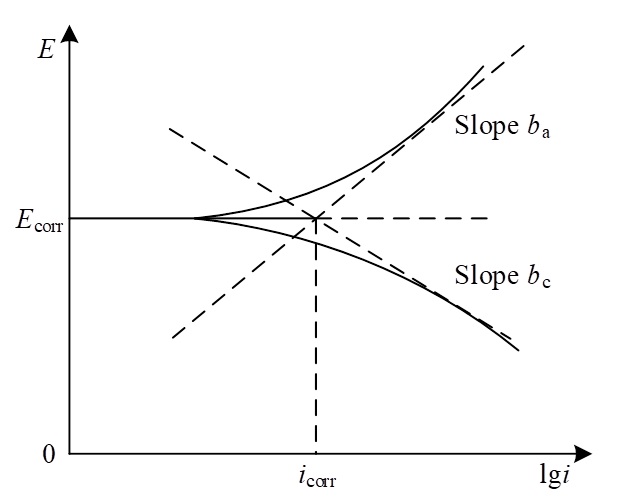
\[\label{GrindEQ__1_} \frac{I}{R_{p} } =2.303\times \left(\frac{b_{c} \times b_{c} }{b_{a} +b_{c} } \right)\times i_{corr} , \tag{1}\] \[\label{GrindEQ__2_} PE={\left(i_{corr}^{EP} -i_{corr} \right)\mathord{\left/ {\vphantom {\left(i_{corr}^{EP} -i_{corr} \right) i_{corr}^{EP} }} \right. i_{corr}^{EP} } \times 100\% . \tag{2}\]
2.4.2 Water absorption test
By conducting water absorption tests on the coating, we can better understand its barrier properties and the penetration of corrosive media. In this paper, the water absorption rate of the coating was tested using the weight method, with the following specific testing steps: After the coating was fully cured, its weight was first measured using a balance. The coating was then immersed in a 4.3 wt% NaCl solution for a certain period of time, removed, and the water on its surface was dried using filter paper. The weight of the coating after immersion was then measured, and the water absorption rate \(w\) was calculated using formula (3): \[\label{GrindEQ__3_} w=\frac{m_{t} -m_{0} }{m_{0} } \times 100\%, \tag{3}\] where, \(m_{0}\) is the mass of the coating before immersion, and \(m_{t}\) is the mass of the coating after immersion for a time of \(t\). To ensure the reliability of the experimental results, the water absorption rate of three parallel samples of each coating was measured, and the average value was taken.
2.4.3 Water contact angle test
Water contact angle testing is used to analyze the wettability and surface energy of solid surfaces, and can be used to study the barrier properties and anti-permeability of coatings. The contact angle measuring instrument used in this paper is a certain model produced by a certain company. The testing steps are as follows: first, place the completely cured coating sample horizontally on the sample stage, then add a drop of water to its surface. After the water has stabilized on the material surface, use a digital CCD camera to take black and white photos and perform calculation and analysis.
3 Research on the adhesion and corrosion resistance of anti-corrosion coatings on different metal surfaces
3.1 Study of conventional coating properties
3.1.1 Mechanical properties and hardness
The coated samples were subjected to tensile testing and hardness testing under standard conditions. The experimental data for tensile strength and elongation at break for different coatings are shown in Table 2. The tensile strengths of the X1, X2, and X3 coatings were measured to be 20.48 MPa, 13.53 MPa, and 4.06 MPa, respectively, with elongation at break values of 511.52%, 11.44%, and 45.78%, respectively. The Shore A hardness values were 85, 81, and 42, respectively.
| Sample number | X1 | X2 | X3 |
|---|---|---|---|
| Tensile strength/MPa | 20.48 | 13.53 | 4.06 |
| Elongation at break/% | 511.52 | 11.44 | 45.78 |
| Hardness/Shore A | 85 | 81 | 42 |
The tensile strength, elongation at break, and hardness of X1 are higher than those of the other two coatings. Specifically, the tensile strength of the X1 coating is approximately five times that of X3 (the others follow the same principle) and 1.5 times that of X2. X1 is a copolymer formed by alternating soft and hard segments, with a molecular structure similar to that of X2. The urea bonds in the polymer have higher bond energies, and the higher content of nitrogen and oxygen atoms increases the internal bond strength, resulting in very high tensile strength. The lower tensile strength of X3 is due to the addition of a certain proportion of flake mica powder, which enhances the coating’s shielding effect against corrosive media, thereby improving its corrosion resistance.
The elongation at break of the X1 coating is significantly higher than that of the other two coatings, being 47 times that of the X2 coating and 11 times that of the X3 coating. The X1 coating exhibits excellent elasticity, enabling it to withstand significant deformation and impact during engineering applications while maintaining good continuity without defects such as cracks that could impair its corrosion resistance. In contrast, the X3 and X2 coatings exhibit some brittleness and cannot withstand deformation or impact during use. Therefore, in engineering corrosion protection applications, the X1 corrosion-resistant coating is more suitable for areas where deformation is likely to occur.
Hardness is the local resistance of a solid to external intrusion, serving as an indicator for comparing the softness and hardness of various materials. It represents a material’s ability to resist elastic deformation, plastic deformation, or failure, as well as its ability to resist residual deformation and counteract failure. X1, X2, and X3 coatings all have high hardness values. The hardness values of X1 and X2 coatings are comparable, while X3 is relatively lower, at only Shore A42. The hardness of a coating is closely related to its material structure. Both X1 and X2 coatings contain soft and hard segments, with different proportions, and exhibit high cross-linking density and hydrogen bonding, resulting in high hardness. A higher coating hardness results in a higher Young’s modulus of elasticity, making the coating’s elastic modulus more closely aligned with that of the metal substrate. Therefore, when subjected to tensile forces, internal stresses, temperature stresses, or external forces, the deformation of a high-hardness coating is more similar to that of the metal substrate, reducing the likelihood of damage caused by internal stresses. However, the hardness of the coating cannot be increased indefinitely, as it is determined by the internal structure of the polymer material. Additionally, increasing the hardness of the coating will cause a decline in its other properties, with low-temperature brittleness becoming particularly pronounced.
3.1.2 Gel time and surface drying time
Gel time and surface dry time are two important indicators for evaluating the curing time of coatings. Gel time and surface dry time have a significant impact on the application process of coatings. An appropriate curing time can effectively improve project progress. The experimental results for gel time and surface dry time of different coatings are shown in Table 3. X1 has extremely short gel time and surface dry time, with a gel time of only 9 seconds and a surface dry time of only 52 seconds. A gel time of 9 seconds allows X1 to be sprayed at any thickness during application without causing sagging that affects aesthetics, and it can be applied to surfaces of any shape. The 52-second surface drying time allows X1 to undergo a second coating in a very short time, significantly reducing construction time. However, the short gel time and surface drying time also have drawbacks. The very short gel time prevents X1 from effectively wetting the metal substrate surface, resulting in poor adhesion between X1 and the metal. Therefore, when applying X1 to a metal substrate surface, a primer must be used. Since the coating cannot be completed in a single day, the short surface drying time also leads to poor interlayer adhesion, necessitating the use of an interlayer adhesive to enhance adhesion between X1 layers.
| Sample number | X1 | X2 | X3 |
|---|---|---|---|
| Surface drying time | 52s | 2.1h | 3.2h |
| Gel time | 9s | 3.6h | 6.7h |
X3 and X2 have long gel times of 6.7 hours and 3.6 hours, respectively. X3 and X2 are both two-component coatings that must be mixed before application. If the gel time is too short, it makes application very difficult. If spray application is used, it can easily clog the spray equipment and cause damage. A very long gel time means the coating cannot be applied too thickly, as this can lead to sagging and uneven thickness.
The surface drying times for X3 and X2 are 3.2 hours and 2.1 hours, respectively. To accommodate the gelation time requirements, the reaction activity of the products was reduced during design, resulting in slower reaction rates. The prolonged surface drying time can cause the amino groups in X2 to react with moisture in the air, leading to foaming and other phenomena that impair corrosion resistance and affect construction timelines. However, the extended surface drying time effectively enhances the adhesion of the coating.
3.2 Structural characterization
3.2.1 Infrared absorption spectroscopy
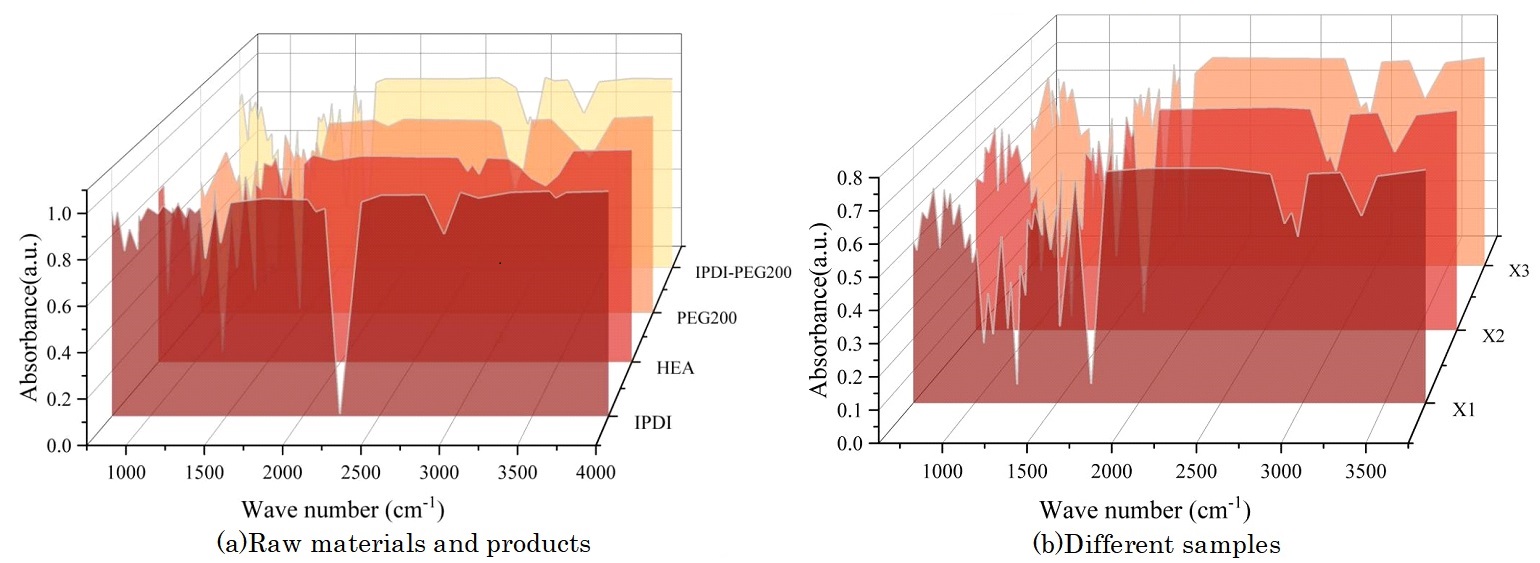
Taking the X1 coating as an example, the infrared absorption spectra of the raw materials and products are shown in Figure 4(a). The strong and sharp vibrational absorption peak at 2244 cm\(^{-1}\) is characteristic of the -NCO group in IPDI. The broader vibrational absorption peaks observed at 3549 cm\(^{-1}\) for PEG200 and at 3410 cm\(^{-1}\) for HEA are characteristic of the -OH groups in their molecular structures. Due to stronger hydrogen bonding interactions between HEA molecules, its -OH characteristic peak shifts toward lower wavenumbers. In the infrared absorption spectrum of HEA, the vibrational absorption peaks at 1635 cm\(^{-1}\) and 1052 cm\(^{-1}\) correspond to the stretching vibration of the C=C double bond and the bending vibration of the C-H bond on the double bond, respectively. In the infrared absorption spectrum of the product IPDI-PEG200, the characteristic absorption peak of the -NCO group at 2244 cm\(^{-1}\) disappears, and a sharper -NH absorption peak appears at 3341 cm\(^{-1}\), which is more pronounced than the -OH absorption peak. This indicates that the -NCO group reacted with the -OH group to form an urethane bond. Additionally, characteristic peaks of the double bond were observed at 1635 cm\(^{-1}\) and 1052 cm\(^{-1}\) in the product, indicating successful capping with HEA. The infrared absorption spectra of all corrosion-resistant coating samples on metal surfaces are shown in Figure 4(b), where the characteristic peak of the -NCO group at 2244 cm\(^{-1}\) has disappeared, and the characteristic absorption peak of the -NH group at 3341 cm\(^{-1}\) has appeared. Additionally, the characteristic peaks of the double bond at 1635 cm\(^{-1}\) and 1052 cm\(^{-1}\) are also observed.
3.2.2 Hydrogen nuclear magnetic resonance spectrum
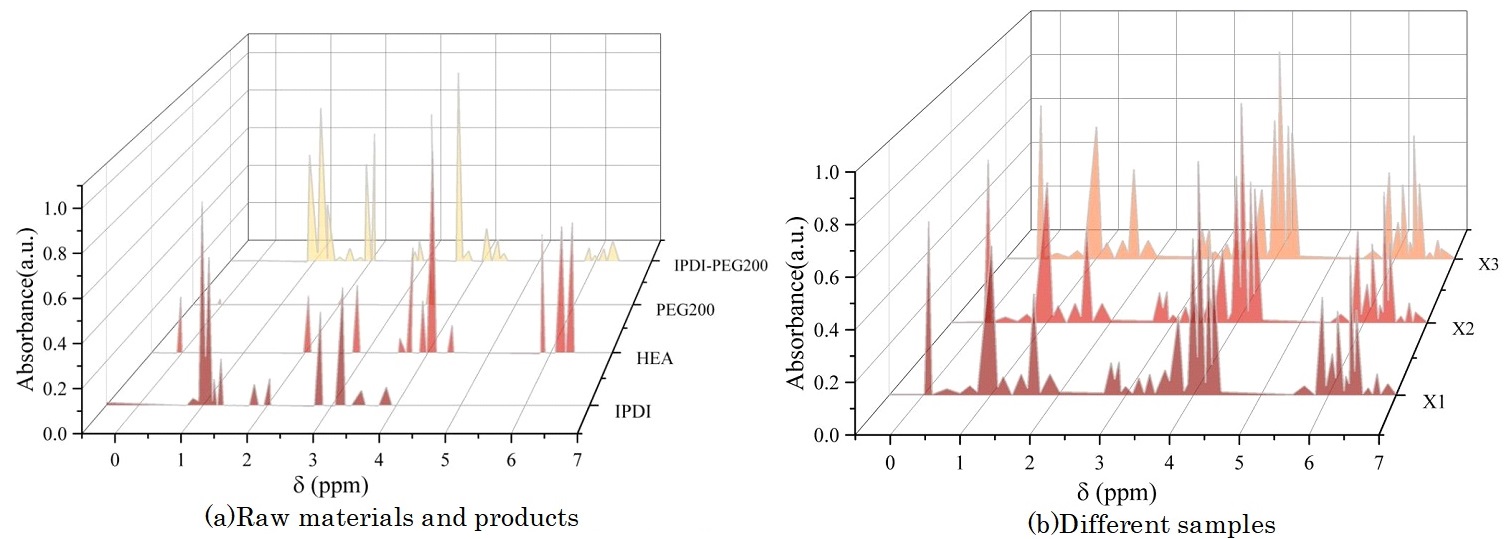
The hydrogen nuclear magnetic resonance spectra of the raw materials and products of the X1 coating sample are shown in Figure 5(a). The proton peaks at 0.8–2.1 ppm correspond to the H atoms of the methyl groups on the IPDI ring structure (7–15), while the proton peak at 4.0 ppm corresponds to the H atoms of the methylene groups in PEG200 (13, 14), the proton peaks at 6.0–6.7 ppm correspond to the H atoms on the acryloxy double bond in HEA (2, 3, 4), and additionally, a proton peak corresponding to the hydrogen on the urethane bond appears at 7.2 ppm. This peak is relatively weak due to the strong hydrogen bonding in the polyurethane. Overall, this confirms the successful synthesis of IPDI-PEG200. The hydrogen nuclear magnetic resonance spectra of all the corrosion-resistant coating samples synthesized in this study are shown in Figure 5(b), where the corresponding proton peaks can be observed in all cases.
3.3 Experimental results
3.3.1 Water absorption rate
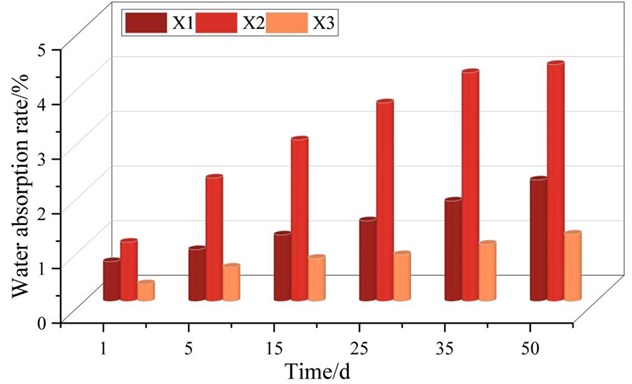
Metal corrosion is primarily initiated by the infiltration of water molecules. Water not only transports various corrosive agents, such as salts and acids, to the metal surface, but it also brings dissolved oxygen, which serves as a catalyst for the corrosion process. Therefore, evaluating the water absorption rate of protective coatings is fundamental for understanding their anti-corrosive mechanisms and long-term effectiveness in harsh environments. The water absorption rates for different coatings at various time intervals are illustrated in Figure 6. Among the three, the X3 coating demonstrates the lowest water absorption rate, followed by the X1 coating, while the X2 coating exhibits the highest rate. The maximum water absorption for the X3 coating is approximately 1.23%. Such a low rate suggests that the X3 coating possesses excellent waterproofing capabilities and barrier properties, thereby providing outstanding corrosion protection.
In comparison, the X1 coating, with a maximum water absorption rate of about 2.22%, generally has a greater thickness. This increased thickness helps minimize the number of through-holes caused by air bubbles within the coating matrix, thus enhancing its water resistance to a certain extent. On the other hand, the X2 coating records a significantly higher maximum water absorption rate of 4.33%. This is attributed to its incomplete internal structure, characterized by a large number of pores and defects, which allows water to penetrate more readily and compromises its protective effectiveness.
The water absorption rate of anti-corrosion coatings has a direct impact on the speed at which aggressive agents reach the underlying metal, as well as the overall corrosion resistance of the system. When the water absorption rate is high, corrosive media can more easily migrate through the coating and accelerate the corrosion of the metal substrate. Based on the experimental data, it can be concluded that metal corrosion occurs more rapidly under the X2 coating than under the X1 and X3 coatings, due to its higher water absorption and less effective barrier properties.
3.3.2 Wet adhesion
The destruction of organic coating adhesion is a process involving both thermodynamic and kinetic effects. It is difficult to keep the metal surface free of contaminants before coating, and metal oxides and water molecules are often present. The oxygen-containing polar groups in the organic coating can form hydrogen bonds with these metal oxides and water molecules. When water molecules penetrate the coating/metal interface, they disrupt the hydrogen bonds formed between the coating and the metal, causing the coating to lose its adhesion. In a dry state, water molecules at the coating/metal interface leave the interface, allowing the hydrogen bonds between the coating and metal to reform. Thus, in the presence of water, the coating itself does not exhibit any macroscopic changes, but wet adhesion has already been compromised. The results of wet adhesion tests on different coatings immersed in water baths at different times and temperatures are shown in Table 4.
| X1/MPa | X2/MPa | X3/MPa | |||||||
|---|---|---|---|---|---|---|---|---|---|
| 22\(\mathtt{{}^\circ\!{C}}\) | 60\(\mathtt{{}^\circ\!{C}}\) | 100\(\mathtt{{}^\circ\!{C}}\) | 22\(\mathtt{{}^\circ\!{C}}\) | 60\(\mathtt{{}^\circ\!{C}}\) | 100\(\mathtt{{}^\circ\!{C}}\) | 22\(\mathtt{{}^\circ\!{C}}\) | 60\(\mathtt{{}^\circ\!{C}}\) | 100\(\mathtt{{}^\circ\!{C}}\) | |
| 0d | 5.06 | 4.97 | 5.01 | 4.23 | 4.05 | 4.11 | 3.65 | 3.65 | 3.71 |
| 1d | 4.86 | 4.83 | 3.62 | 3.74 | 3.96 | 2.73 | 3.46 | 3.48 | 3.27 |
| 5d | 4.75 | 4.11 | 3.15 | 3.56 | 3.42 | 1.42 | 3.28 | 3.11 | 2.55 |
| 15d | 4.56 | 4.03 | 3.04 | 3.41 | 2.41 | 0.17 | 3.11 | 3.02 | 1.26 |
| 25d | 4.37 | 3.64 | 2.93 | 3.32 | 2.28 | – | 3.02 | 2.93 | 1.04 |
| 35d | 4.01 | 2.81 | 1.72 | 3.15 | 1.96 | – | 2.97 | 2.67 | – |
| 50d | 3.86 | 2.25 | – | 2.83 | 0.92 | – | 2.88 | 1.65 | – |
At 22\(\mathrm{{}^\circ}\)C, all coatings maintained no blistering or peeling for 50 days, with adhesion remaining above 2.5 MPa. Among these, X3 coating adhesion decreased by 21%, X2 coating by 33%, and X1 coating by 24%. In a 60\(\mathrm{{}^\circ}\)C water bath, none of the coatings showed peeling or bubbling. However, in a 100\(\mathrm{{}^\circ}\)C water bath, the X3 coating exhibited bubbling at 35 days, the X2 coating at 25 days, with very low adhesion at 15 days, making it difficult to meet corrosion protection requirements, and the X1 coating showed bubbling at 50 days. From the coatings selected for this experiment, and from the perspective of wet adhesion, the corrosion resistance of the X2 coating is inferior to that of the other two coatings.
3.4 Analysis of corrosion resistance mechanisms
3.4.1 Polarization curve test
Based on the findings from both the comprehensive water absorption and adhesion tests, the X1 coating—demonstrating the most favorable overall properties—was selected for in-depth investigation of its corrosion resistance. To assess its durability under aggressive conditions, seven small metal specimens coated with X1 were fully immersed in a 4.3% NaCl aqueous solution to simulate a marine environment. At predetermined intervals, one specimen was extracted from the solution for electrochemical analysis, while the remainder continued immersion. The electrochemical data corresponding to each immersion period were obtained, and the polarization curves for these different exposure durations are presented in Figure 7.
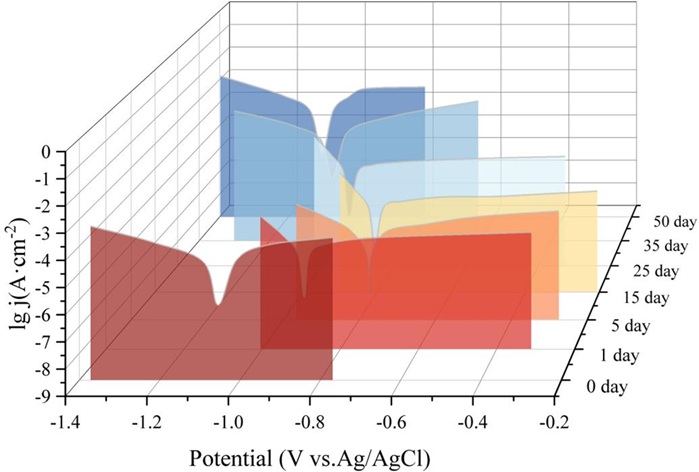
As the exposure time in the saline solution increased, it was observed that the self-corrosion current density (\(i_{corr}\)) of the X1 coating initially decreased, reaching a minimum before subsequently increasing, while the self-corrosion potential (\(E_{corr}\)) exhibited the opposite trend, first increasing and then declining. A lower self-corrosion current density is indicative of a slower corrosion rate, suggesting enhanced resistance to the ingress of corrosive agents and a prolonged service life for the coating. Upon detailed comparison, it was found that the minimum self-corrosion current density occurred on the 5th day of immersion, measured at 1.875\(\mathrm{\times}\)10\(^{-6}\) A\(\cdot\)cm\(^{-2}\), which corresponds to the slowest rate of electrochemical corrosion and represents the peak corrosion resistance of the X1 coating during the test period. However, following the 5th day, the self-corrosion current density began to rise steadily, signifying that the coating was being increasingly compromised by prolonged exposure to the saline environment. This ongoing deterioration resulted in a gradual decline in the coating’s protective capabilities, and by the 35th day of immersion, significant corrosion was evident, including the formation of visible red rust on the metal substrate.
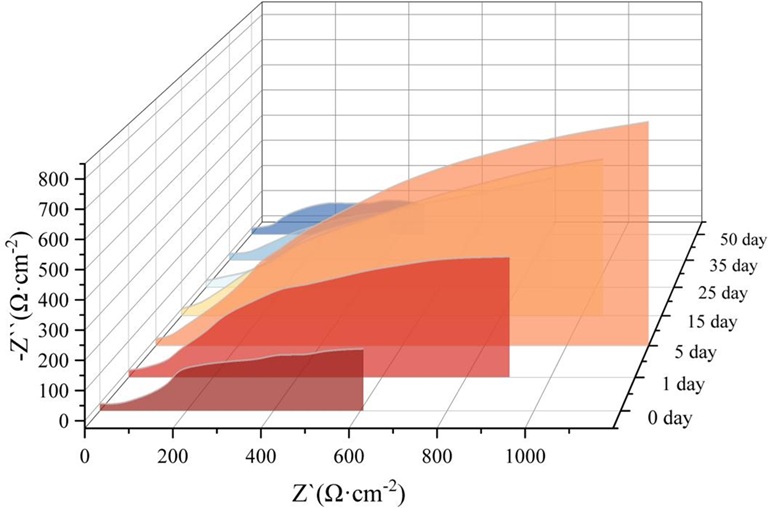
3.4.2 AC impedance spectrum testing
AC impedance spectroscopy is an electrochemical method that uses a low-amplitude sinusoidal potential as a disturbance signal to measure coating systems. The measurement results can provide detailed information about the dielectric properties of the coating and related corrosion information of the coating or metal surface. By observing the Nyquist plot of the coating, the corrosion resistance of the coating can be analyzed under varying AC frequencies. AC impedance spectroscopy tests were conducted on X1 coatings immersed in a 4.3% NaCl aqueous solution for different durations. The Nyquist plots of the coatings are shown in Figure 8. The impedance spectra of the coatings obtained after immersion in saltwater for different durations exhibit similar shapes, with corresponding Nyquist plots featuring two capacitive arcs. The small capacitive arc at high frequencies is related to the physical resistance of the coating, while the large capacitive arc at low frequencies is associated with corrosion reactions involving the zinc-aluminum powder in the coating. The impedance spectra of all coatings exhibit two time constants, indicating that the electrolyte has penetrated the coating surface and undergone electrochemical reactions. From 0 to 5 days, the amplitude of the low-frequency capacitive arc gradually increases. This is because the initial reactions produce insoluble corrosion products that cover the surface of the chromium-free zinc-aluminum corrosion-resistant coating, blocking the original corrosion pathways and preventing further corrosion of the metal powder. As corrosion time increases, the blocking effect of corrosion products on pores gradually becomes weaker than the corrosive medium’s erosion of the coating. Once the equilibrium is disrupted, more corrosion pathways are exposed, and the corrosive medium continues to intensify its erosion of the coating, resulting in a gradual decrease in the low-frequency capacitive reactance amplitude of the coating.
An AC impedance spectrum fitting circuit was used for analysis, with the fitting results shown in Table 5. In the circuit diagram used, R\({}_{s}\), R\({}_{c}\), C\({}_{c}\), R\({}_{ct}\), and C\({}_{dl}\) represent the solution resistance, coating resistance, coating capacitance, charge transfer resistance, and double-layer capacitance of the electrochemical reaction in the measurement system, respectively. The solution resistance R\({}_{s}\) of all coatings is similar, while the coating resistance R\({}_{c}\) first increases and then decreases. Additionally, the coating resistance value after 35 days of saltwater immersion is lower than that at 0 days. This change occurs because, as the coating is immersed in saltwater, the metal powder on the coating surface undergoes an activation reaction, producing insoluble corrosion products that accumulate on the coating surface and in smaller pores. Initially, the coating is strengthened, but as the corrosion time increases, this strengthening effect gradually becomes weaker than the electrochemical corrosion effect. Part of the metal powder on the coating surface is corroded and peels off, causing the coating resistance to gradually decrease. Based on the R\({}_{ct}\) results, it can be seen that from 0 to 15 days, the charge transfer resistance of the X1 coating immersed in the NaCl solution gradually increases and reaches a maximum value of 1653.85 \(\Omega\)·cm\(^{-2}\) on the 15th day. At this point, the electrochemical corrosion reaction on the coating surface is slowest, the coating is most dense, and the shielding effect is strongest, making it difficult for the corrosive medium to penetrate the coating. As the immersion time continues to increase, corrosion deepens, and the charge transfer resistance of the coating gradually decreases, dropping to 539.37 \(\Omega\)·cm\(^{-2}\) by day 50, which is below the initial value at day 0. Combined with the macroscopic morphology of the coating, it can be concluded that red rust has formed at this point, and the coating has been damaged.
| R\({}_{s}\)/\(\Omega\)·cm\({}^{-2}\) | C\({}_{c}\)/F·cm\({}^{-2}\) | R\({}_{c}\)/\(\Omega\)·cm\({}^{-2}\) | C\({}_{dl}\)/F·cm\({}^{-2}\) | R\({}_{ct}\)/\(\Omega\)·cm\({}^{-2}\) | |
|---|---|---|---|---|---|
| 0d | 17.94 | 9.286\(\mathrm{\times}\)10\({}^{-5}\) | 60.04 | 2.546\(\mathrm{\times}\)10\({}^{-3}\) | 902.45 |
| 1d | 18.06 | 9.647\(\mathrm{\times}\)10\({}^{-5}\) | 62.31 | 2.617\(\mathrm{\times}\)10\({}^{-3}\) | 929.64 |
| 5d | 19.37 | 1.047\(\mathrm{\times}\)10\({}^{-4}\) | 68.06 | 2.786\(\mathrm{\times}\)10\({}^{-3}\) | 1301.48 |
| 15d | 22.75 | 1.975\(\mathrm{\times}\)10\({}^{-4}\) | 85.23 | 3.012\(\mathrm{\times}\)10\({}^{-3}\) | 1653.85 |
| 25d | 27.08 | 4.983\(\mathrm{\times}\)10\({}^{-5}\) | 80.49 | 2.504\(\mathrm{\times}\)10\({}^{-3}\) | 1195.38 |
| 35d | 19.85 | 1.525\(\mathrm{\times}\)10\({}^{-4}\) | 54.18 | 4.682\(\mathrm{\times}\)10\({}^{-3}\) | 613.53 |
| 50d | 24.11 | 7.557\(\mathrm{\times}\)10\({}^{-5}\) | 48.36 | 1.606\(\mathrm{\times}\)10\({}^{-3}\) | 539.37 |
Hence, the X1 coating provides excellent physical shielding protection and electrochemical corrosion protection for metal substrates. As corrosion time increases, the density of the X1 coating first increases and then deteriorates due to erosion, resulting in a rise and subsequent decline in its corrosion protection performance.
4 Conclusion
This paper confirms the following conclusions through multi-scale characterization.
Mechanical properties and hardness. The tensile strength, elongation at break, and hardness of X1 are higher than those of the other two coatings. Specifically, the tensile strength of the X1 coating is five times that of X3 and 1.5 times that of X2. The elongation at break of the X1 coating is significantly greater than that of the other two coatings, being 47 times that of the X2 coating and 11 times that of the X3 coating. The hardness values of the X1 and X2 coatings are comparable, while the X3 coating has a relatively lower hardness. The excellent mechanical properties of the X1 coating provide a foundation for its superior corrosion resistance.
Curing time. The surface drying time for X3 and X2 is 3.2 hours and 2.1 hours, respectively, and the gel time is 6.7 hours and 3.6 hours, respectively. The surface drying time and gel time for X1 are 52 seconds and 9 seconds, respectively. The very short gel time ensures that X1 can be sprayed in a single application at any thickness, but the very short surface drying time affects the interlayer adhesion between coats.
Water absorption rate. The water absorption rates of the three coatings are 2.22%, 4.33%, and 1.23%, respectively. The X2 coating has a higher water absorption rate than the other two coatings, and its higher water absorption rate results in poorer corrosion resistance compared to the other two coatings.
Wet adhesion. After 50 days in a 22\(\mathrm{{}^\circ}\)C water bath, the wet adhesion of all three coatings exceeded 2.5 MPa. After 50 days in a 60\(\mathrm{{}^\circ}\)C water bath, none of the coatings peeled off. However, the X2 coating showed a more significant decrease in adhesion. At 100\(\mathrm{{}^\circ}\)C, all three coatings exhibited blistering, with blistering times of 50 days, 25 days, and 35 days, respectively. From the perspective of wet adhesion, the X1 coating exhibits superior corrosion resistance.
Corrosion resistance mechanism. From 0 to 15 days, the charge transfer resistance of the X1 coating gradually increased after immersion in a NaCl solution, reaching a maximum value of 1653.85 \(\Omega\)·cm\(^{-2}\) on the 15th day. At this point, the electrochemical corrosion reaction on the coating surface was slowest, the coating was most dense, and the shielding effect was strongest, making it difficult for the corrosive medium to penetrate the coating.