1 Introduction
Ballast tanks are water-filled compartments in ships or floating structures used to regulate draft, buoyancy, and longitudinal trim. Their primary function is to balance fuel consumption and the local weight of cargo to enhance the stability of the vessel and improve its navigational performance [1]. Due to harsh operating environments and complex structures, ballast tanks are prone to corrosion. Since ballast tanks are an integral part of every vessel, and the surface area of ballast tanks on large cargo ships and oil tankers can reach hundreds of thousands of square meters, severe corrosion can result in extremely high repair and reconstruction costs [2, 3, 4]. Given the significant losses caused by ballast tank corrosion in the 1980s, ballast tanks have become the subject of a series of regulations by organizations such as the International Association of Classification Societies (IACS) and the International Maritime Organization (IMO) [5, 6]. For example, in 2004, IACS and other organizations drafted the “Performance Standards for Protective Coatings for Ship-Specific Seawater Ballast Tanks and Bulk Carriers with Double Rudder Side Collection”; in 2008, China released the revised GBT 6823-2008 “Ship Ballast Tank Paint.” Subsequently, a large number of anti-corrosion coatings for ballast tanks were developed. As one of the key technologies for ship protection, anti-corrosion coatings play a crucial role in extending the service life of ships and ensuring their safety performance [7, 8, 9]. However, due to the high microbial content of ballast water, sedimentation of mud at the bottom of the tank caused by water injection/discharge, and a relatively stable environment, ballast tanks are highly conducive to microbial growth (such as mixed communities of sulfur-oxidizing bacteria and nitrate-reducing bacteria). These microorganisms form biofilms and establish corrosion cells at coating defects, resulting in severe corrosion of materials within the ballast tank influenced by biological factors [10, 11, 12, 13]. The pitting corrosion rate of carbon steel bottom plates affected by microbial corrosion can reach up to 2 mm per year, which is an extremely high corrosion rate compared to the 10–15 mm thick steel plates used in ballast tanks [14, 15].
Microbial corrosion (MIC) is not a new type of corrosion but refers to the process by which microorganisms promote electrochemical corrosion by altering the electrochemical conditions at the metal-solution interface [16]. Different microorganisms have varying effects on corrosion: microbial corrosion inhibition, microbial corrosion, or localized corrosion [17]. Although microbial corrosion is not visible to the naked eye, its impact on corrosion in ship ballast tanks is significant. Related studies have shown that biofilms in ballast tanks can be separated and identified into different microbial communities, including slime-forming bacteria (SFB), sulfur-oxidizing bacteria (SOB), iron-oxidizing bacteria (IOB), and sulfate-reducing bacteria (SRB). SFB form biofilms by secreting acidic multifunctional polymers, causing metal ions in the aqueous phase or substrate to accumulate within the biofilm, thereby increasing cathodic reactions and accelerating corrosion rates. The formed biofilms create an anaerobic environment for SRB, whose metabolic byproducts, such as H\(_2\)S, acidify the medium and cause hydrogen to penetrate steel, leading to localized pitting corrosion and inducing cracking [18, 19, 20]. Lv et al. [21] found through high-throughput sequencing that ballast tank sediments contain high levels of SOB and SRB, and the metal corrosion process formed by SRB is highly likely to occur within the tank. Additionally, IOB is generally believed to cause MIC; this organism obtains energy by oxidizing Fe\(^{2+}\) and Mn\(^{2+}\) to Fe\(^{3+}\) and Mn\(^{3+}\) [22]. Since IOB are microaerophilic, meaning they require collaboration with other bacteria such as SFB, IOB influence the corrosion process by forming oxygen concentration gradient batteries. Cells or metal deposits create anoxic zones beneath them, ultimately forming small anode and large cathode corrosion batteries, leading to severe corrosion [23, 24, 25]. The research results of Lv et al. [26] indicate that there are different bacterial communities in ballast water and sediments in ship ballast tanks, with sediments exhibiting greater community diversity. These bacterial communities contribute to microbial corrosion to a certain extent. It is important to emphasize that the microbial corrosion process is caused by a complex interaction of various microorganisms present at the same location, rather than by a single group of microorganisms [27, 28]. Therefore, when evaluating the microbial corrosion resistance of anti-corrosion coatings in ship ballast tanks, this complexity must be considered. However, to date, few studies have assessed the microbial corrosion resistance of anti-corrosion coatings in ship ballast tanks.
In existing studies on the assessment of anti-corrosion coatings in marine environments, Bogatu et al. [29] evaluated the anti-corrosion performance of steel anti-corrosion coatings (epoxy primer and polyurethane coating with Cruzonite particles) in seawater environments through morphological analysis, cross-sectional analysis, structural assessment, and hydrophobicity analysis. The anti-corrosion performance of different steel surfaces and coatings varied. Nugroho et al. [30] analyzed the correlation between ballast tank surface morphology and corrosion pits, finding that as ballast tank volume increases, corrosion pit depth decreases. Yu et al. [31] used the YOLO v5 algorithm to detect, analyze, and evaluate the corrosion status of metal surfaces with different coatings in coastal areas, concluding that fluorocarbon coatings exhibited the best corrosion resistance after 60 months. Stojanović et al. [32] evaluated the corrosion resistance of two ship hull coatings in natural seawater using open-circuit potential measurements, electrochemical impedance spectroscopy, and peel tests. In simulated seawater with agitation, both coatings developed thicker biofilms. However, Zhao et al. [33] pointed out that linear polarization resistance and electrochemical impedance spectroscopy negatively affect biofilm adhesion and growth, while passive electrochemical noise technology does not negatively affect biofilms, making it advantageous for monitoring MIC. This indicates that electrochemical impedance spectroscopy has limitations in assessing the performance of corrosion-resistant coatings. Additionally, Iannucci et al. [34] proposed a method to observe electroactive bacteria by measuring current changes between electrodes in microbial fuel cells, which can also monitor biofilms on material surfaces. These studies did not directly address the assessment of microbial corrosion resistance of ship ballast tank corrosion-resistant coatings but provide technical references.
This paper first elucidates the synergistic mechanisms between electrochemical corrosion and microbial metabolism based on metal corrosion theory. It details the sample preparation process and quantifies the antimicrobial performance of the coating through TCS testing and antibacterial experiments. Combined with electrochemical testing, it analyzes the interface reaction kinetics. By measuring organic acid concentration and DOC values, it elucidates bacterial growth characteristics. Using XPS and AES to analyze the corrosion surface of the coating, it characterizes the corrosion electrochemical behavior of the system via EIS. Raman spectroscopy is employed to monitor the reduction process of SRB on GO. The morphology of the SRB biofilm is observed to confirm the inhibitory effects of GO and rGO. Through multi-scale analysis, the mechanism by which the coating resists SRB corrosion is investigated.
2 Experimental design for the microbial corrosion resistance performance of anti-corrosion coatings
The corrosion of ballast water tanks in ships has long been affected by microbial activity, with SRB being a key corrosion factor due to its acid-producing metabolism and biofilm formation capabilities. This study focuses on analyzing the microbial resistance properties of anti-corrosion coatings.
2.1 Theory of metal corrosion
Metal corrosion (primarily referring to steel) refers to the phenomenon where metal undergoes chemical or electrochemical reactions with the surrounding environment, leading to damage or degradation of the metal. Metal corrosion is classified into four main types based on corrosion mechanisms: chemical corrosion, physical corrosion, biological corrosion, and electrochemical corrosion. Among these, the primary cause of corrosion in ship ballast tanks is electrochemical corrosion. The steel plates exposed to water undergo electrochemical reactions because the ship’s hull steel plates are composed of an alloy structure containing iron, carbon, and other elements. On the surface of the steel, countless micro-batteries form. The corrosion cells formed on the metal surface primarily exhibit anodic reactions on the steel, with their electrochemical reactions being:
Anodic region: \[\label{GrindEQ__1_} Fe->Fe^{2+} +2e^{-} . \tag{1}\]
Cathode area: \[\label{GrindEQ__2_} O_{2} +2H_{2} O+4e^{-} ->4OH^{-} . \tag{2}\]
Due to continuous corrosion reactions on the surface of steel plates, rust will form on the surface of \(Fe\): \[\label{GrindEQ__3_} Fe+2OH^{-} ->Fe\left(OH\right)_{2} , \tag{3}\] \[\label{GrindEQ__4_} 4Fe(OH)_{2} +2H_{2} O+O_{2} ->4Fe(OH)_{3} . \tag{4}\]
The rust layer formed is brittle and cannot prevent corrosion. As long as there is sufficient oxygen in seawater continuously reaching the cathode, electrochemical corrosion will continue. Cathodic protection uses electrochemical principles to connect active metals such as zinc and aluminum to steel, thereby effectively protecting the steel.
2.2 Sample preparation and treatment
2.2.1 Test sample material
According to regulations, ballast tank steel is Grade A ship structure steel, which can corrode spontaneously in seawater. Therefore, Q235 steel was selected as the base material for the experiment and processed into a steel plate with dimensions of \ \(8{\rm cm}\times 3{\rm cm}\times 0.5{\rm cm}\) steel plates. The surface of the base material was degreased and wiped clean, then dried using a hot air blower. The surface was then subjected to sandblasting treatment for approximately 10 minutes using a sandblasting machine. In the experiment, Al powder, Zn powder, and Zn-15Al alloy powder were all prepared using particle atomization methods. The Al powder exhibited relatively regular spherical particles with a particle size distribution range primarily between \(15{\rm \sim 45}\mu {\rm m}\). The Zn powder also exhibited spherical particles, but their sizes were unevenly distributed, with a particle size distribution range of \(2.5{\rm \sim }45\mu {\rm m}\). The Zn-15Al alloy powder exhibited relatively regular spherical particles, with a particle size distribution range of \(15{\rm \sim }55\mu {\rm m}\).
2.2.2 Sample preparation
Cold spray technology primarily involves high-speed particles colliding with the substrate surface, causing severe plastic deformation and thereby forming the basic structure of the coating. From a macro perspective, the critical velocity of the particles and their velocity upon impact with the substrate determine the degree of bonding between the particles and the substrate. Factors influencing particle velocity include particle material properties, particle size, oxide content on the particle surface, initial temperatures of the substrate and particles, and substrate movement velocity. Additionally, factors such as the type of working gas, gas temperature, carrier gas pressure, spray distance, and feed rate also affect coating quality. In this experiment, Al powder, Zn powder, and Zn-15Al alloy powder were used, and a \(Al-50\% Zn\) composite powder was prepared by mechanically mixing them in a volume ratio of 1:1. The powder was sieved using a standard sieve with a mesh size of 300 to 700 mesh. To ensure powder flowability, the powder was dried in a heating chamber at a temperature of \(105\) for 25 minutes prior to the experiment. The three coatings used in the experiment were produced using equipment from a university’s cold spray laboratory. High-pressure air was used as the spray carrier gas, and the spray parameters were optimized based on the laboratory’s existing spray parameters to determine the spray process parameters.
2.2.3 Sample preparation
To facilitate better observation of the surface morphology of the coating, the prepared cold spray coating was cut into \(8{\rm mm}\times 8{\rm mm}\) sample pieces using wire cutting. The sample pieces were encapsulated with epoxy resin, except for the coating cross-section. The coating surface was cleaned with distilled water, anhydrous ethanol, acetone to clean the coating surface, and dried them with a hair dryer.
Before observing the pores on the coating surface using a metallographic microscope, the coating was cut into \(8{\rm mm}\times 8{\rm mm}\) sample pieces, embedded using an embedding machine to expose the observation cross-section, and then polished using 250#, 500#, 1000# sandpaper to grind the cross-section of the small pieces, and polish them using a metallographic polishing machine. Successively use W6.5 and W3 diamond polishing solutions, then clean with deionized water, wipe with anhydrous ethanol, and finally dry the surface with a hot air blower for observation.
For electrochemical testing, copper wires are first welded to the uncoated side of the sample’s back. The sample pieces are then encapsulated with epoxy resin, exposing only a \(2{\rm cm}^{2}\) working area. Different coatings are categorized and labeled, prepared as working electrodes for electrochemical testing to evaluate the electrochemical performance of the coatings and substrate.
2.3 Research methods
2.3.1 Sample characterization
A scanning electron microscope (SEM) was used to observe the microstructure of the prepared samples. Transmission electron microscopy (TEM) was employed to examine the samples. Fourier transform infrared spectroscopy (FTIR) was utilized to analyze the structural characteristics of the nanocapsules and membrane layers. A contact angle measuring instrument was used to determine the surface wettability of the multilayer membrane. An atomic force microscope (AFM) was employed to observe the surface morphology of the membrane layer. A dynamic light scattering instrument (DLS) was used to measure the Zeta potential and the average diameter of the samples. The chemical structures of dextran and DA were characterized using a proton nuclear magnetic resonance spectrometer (1H-NMR).
2.3.2 TCS performance testing
Measure 3 mL of the sample solution and add it to a dialysis bag. Immerse the dialysis bag in 200 mL of phosphate-buffered saline (PBS) with different pH values (pH = 3.5, 4.5, 5.5, 6.5, and 7.5) phosphate-buffered saline (PBS). Using a UV-Vis spectrophotometer, 1 mL of dialysate was measured at intervals to determine its absorbance at a wavelength of 281 nm. Combined with the standard curve of TCS, the release concentration of TCS over time was obtained. To test the pH-responsive release performance of TCS from the (DA-TCS@CTAB/TA/CH) \({}_{n}\) membrane layer, the sample was immersed in 7.5 mL of phosphate-buffered saline (PBS) at different pH values (pH = 3.5, 4.5, 5.5, 6.5, 7.5). The same method was used to obtain the release curves of TCS under different pH conditions.
2.3.3 Antimicrobial performance testing
The sulfate-reducing bacteria (SRB) used in this paper were provided by a key laboratory. Bacteria were cultured using LB medium, which consisted of 15 g/L peptone, 7.5 g/L yeast extract, and 15 g/L NaCl. The SRB strain was cultured overnight at 25\(\mathrm{{}^\circ}\)C with shaking and kept for later use.
1) Short-term antibacterial performance test. Measure \(15\mu {\rm L}\) of activated bacterial suspension and add it to tubes containing 15 mL of LB medium with different pH values (pH = 3.5, 5.5, 7.5) LB medium. Dip a glass slide coated with a (DA-TCS@CTAB/TA/CH) n membrane layer into the medium and incubate at 25\(\mathrm{{}^\circ}\)C and 200 rpm in a constant-temperature shaking incubator for 24 hours. Remove \(15\mu {\rm L}\) of bacterial suspension and transfer it to a laminar flow hood for serial dilution. Take \(15\mu {\rm L}\) of the diluted sample and spread it evenly on agarose solid medium. Incubate at 25\(\mathrm{{}^\circ}\)C for 24 hours, then count the bacterial colonies (CFU). The inhibition rate is calculated using formula (5): \[\label{GrindEQ__5_} {\rm Antibacterial\; rate}\left({\rm \% }\right)=\left(1-N_{t} /N_{0} \right)\times 100 . \tag{5}\]
Among these, \(N_{0}\) and \(N_{t}\) represent the viable cell counts of the bacterial suspension in the blank control and after treatment with the (DA-TCS@CTAB/TA/CH) \({}_{n}\) membrane layer, respectively.
Additionally, glass slides coated with the (DA-TCS@CTAB/TA/CH)\({}_{n}\) membrane layer were incubated in LB medium for 24 hours, and the distribution of live/dead cells on their surfaces was observed using a laser confocal microscope (GLSM). Prior to observation, \(1.5\mu {\rm L}\) of SYTOX nucleic acid dye (which makes live cells appear green under GLSM) and \(0.5\mu {\rm L}\) of propidium iodide dye (which makes dead cells appear red under GLSM) were sequentially added to 2 mL of deionized water to obtain a mixed solution. The sample was removed and placed in the above solution, left in the dark for 20 minutes for staining, and then inverted on a clean cover slip for CLSM observation.
2) Long-term antibacterial performance test. The sample with the deposited (DA-TCS@CTAB/TA/CH)\({}_{n}\)-layer membrane was immersed in 10 mL of phosphate-buffered saline (PBS) with different pH values (pH = 3.5, 4.5, 5.5, 6.5, and 7.5) phosphate-buffered saline (PBS). At days 1, 5, 10, 30, and 50, the samples were removed, washed, dried, and subjected to antibacterial experiments, following the procedures described in 1) Short-term antibacterial performance testing.
2.3.4 Electrochemical experiments
In electrochemical-related tests, a three-electrode system is used for the electrolytic cell. The coated sample serves as the working electrode, the saturated calomel electrode is selected as the reference electrode, and the graphite electrode is used as the auxiliary electrode. The test medium is a 4.0% NaCl solution, and the tests are conducted at room temperature (20\(\mathrm{{}^\circ}\)C). When initially measuring the electrochemical properties of the coating, the corrosion medium penetrates the coating rapidly, resulting in significant changes in the electrochemical properties. Measurements are taken three times daily. Once the changes in the coating’s electrochemical properties stabilize, the measurement frequency is reduced accordingly. To ensure the accuracy of the experimental data, the corrosion solution used in the experiments is replaced regularly, and a multi-parameter water quality analyzer is used to maintain constant solution temperature and oxygen levels.
1) Electrochemical impedance spectroscopy measurement. Electrochemical impedance spectroscopy measurements involve perturbing the coating system using a small sinusoidal alternating current signal and collecting information on the system’s response to the applied perturbation at steady state to measure the impedance value of the coating system. An equivalent circuit composed of a resistor \(R\) and capacitor \(C\) network is then established to fit the measured data, enabling the study of how the coating resistance, coating capacitance, and other parameters change over time, thereby obtaining information related to the coating’s protective performance.
The electrochemical impedance spectroscopy measurements in this study were conducted using a multi-channel electrochemical workstation, with the VersaStudio measurement software as the testing software. The measurements were performed at open-circuit potential, with a measurement frequency range of 10 mHz to 100 kHz, a sinusoidal signal amplitude of 10 mV, and a working area of 100 cm\(^{2}\). The measured EIS data were analyzed using Zsimp Win software.
2) Linear polarization measurement. Linear polarization is a widely used electrochemical method for measuring the corrosion rate of metals. It applies a very small polarization current to the sample, which does not damage the surface state of the sample, and can quickly and sensitively measure the corrosion rate of the sample. The principle is to apply a polarization current to the working electrode, causing the potential of the working electrode to vary near the self-corrosion potential, and then measure the polarization resistance, which can also be converted into the corrosion current. The polarization resistance measurement formula under activation control is: \[\label{GrindEQ__6_} R_{p} =\frac{\Delta E}{\Delta I} =\frac{b_{a} b_{c} }{2.303(b_{a} +b_{c} )} \times \frac{1}{i_{c} } . \tag{6}\]
Here, \(R_{p}\) is the polarization resistance, \(\Delta E\) is the polarization potential, \(\Delta I\) is the polarization current density, \(i_{c}\) is the self-corrosion current density of the coated metal (A/cm\(^{2}\)), typically expressed as \(\mu A/cm^{2}\), and \(b_{a}\) and \(b_{c}\) are the Tafel constants.
For coating systems, the polarization resistance measured using linear polarization technology actually includes the coating resistance, the surface polarization resistance of the substrate metal, the resistance of the corrosion solution, and the resistance of the wires. The linear polarization method provides comprehensive test results for coating systems, and the related comprehensive information obtained can be used to assist in evaluating the protective performance of the coating system.
The linear polarization measurement method in this paper also uses the American PARSTATTMMC multi-channel electrochemical workstation for measurement, with a scanning range of \(\mathrm{\pm}\)20 mV relative to the open-circuit potential, a scanning speed of 10 mV/min, and a working area of 100 cm\(^{2}\).
3) Coating adhesion measurement. This experiment uses the ASTM D4541 portable adhesion tester to test coating adhesion. Five adhesion pull-off tests are conducted on each sample, and the average of the five measurement results is taken as the adhesion value of the coating sample.
3. Assessment of the microbial corrosion resistance of anti-corrosion coatings in ship ballast water tanks
3.1 Bacterial growth characteristics
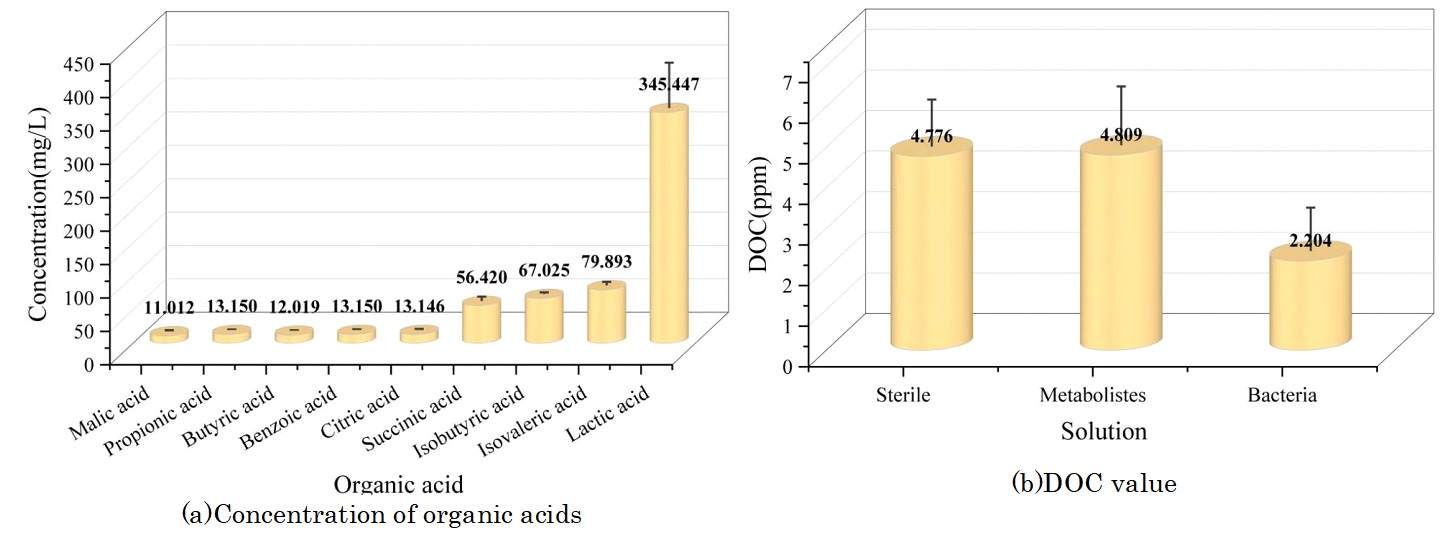
To further verify the potential of sulfate-reducing bacteria (SRB) to generate acidic substances in a condensate simulation fluid, the concentration of organic acids in the bacterial culture medium was analyzed after 7 days of incubation. As illustrated in Figure 1(a), SRB cells actively produced a range of organic acids in the simulated condensate solution—including lactic acid, isovaleric acid, isobutyric acid, and succinic acid, among others. The total concentration of these organic acids exceeded 500 mg/L, clearly indicating that organic acid production through bacterial metabolism was the primary reason for the observed decrease in the pH value of the culture medium. Furthermore, dissolved organic carbon (DOC) levels were compared across various solutions to provide a comprehensive assessment. Figure 1(b) shows that after 7 days of constant-temperature incubation, the DOC values of both the sterile condensate water simulation solution and the bacterial metabolite solution were nearly the same. However, the DOC value in the condensate water simulation solution inoculated with SRB dropped to only 2.204 ppm, which was markedly lower than those observed in the sterile and metabolite groups where no bacterial growth occurred. This significant reduction demonstrates that SRB cellular respiration has a direct impact on the DOC of the solution, with the consumption of oxygen during bacterial activity leading to a noticeable decrease in DOC values over time.
3.2 Corrosion surface analysis
3.2.1 XPS analysis
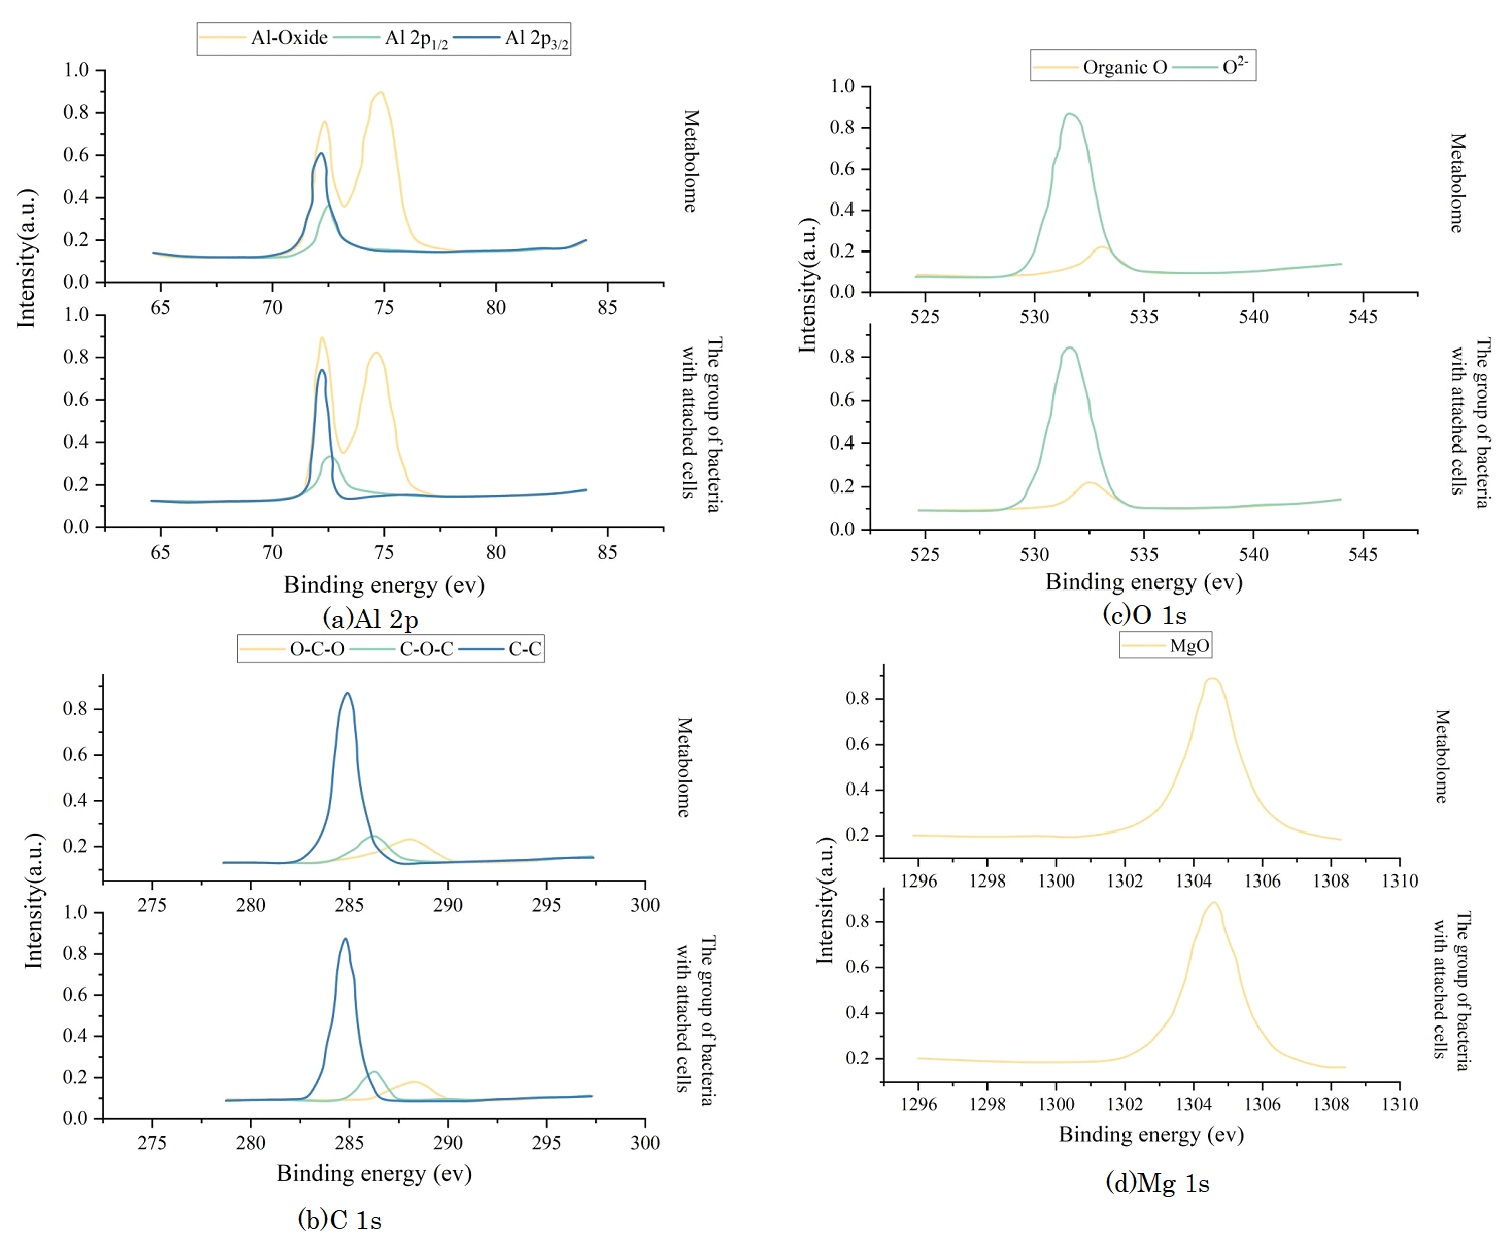
To thoroughly investigate the metabolic activity of sulfate-reducing bacteria (SRB) and to further understand the influence of bacterial cells on the surface composition and chemical state of the protective coating, X-ray photoelectron spectroscopy (XPS) testing and analysis were performed on the surfaces of two groups of coating samples following seven days of immersion under experimental conditions. The detailed results of the XPS analysis are presented in Figure 2, and primarily include high-resolution spectra for Al 2p, C 1s, O 1s, and Mg 1s. It is evident from the data that the Al 2p high-resolution spectra for both groups are quite similar, indicating the presence of both metallic aluminum and various aluminum oxides on the surfaces. Additionally, the high-resolution spectra of C 1s, O 1s, and Mg 1s in the two sample groups also display similar peak patterns and distributions, although there are some noticeable differences in the origins of the organic elements present. The detection of carbon and its associated organic groups in these samples can be attributed not only to the components of the culture medium itself, but, more importantly, to the adsorption and accumulation of metabolic products produced by SRB on the metal surface, as well as to the development of bacterial biofilms. This suggests that the activity of SRB significantly impacts the chemical composition and surface properties of the coatings during immersion.
3.2.2 AES analysis
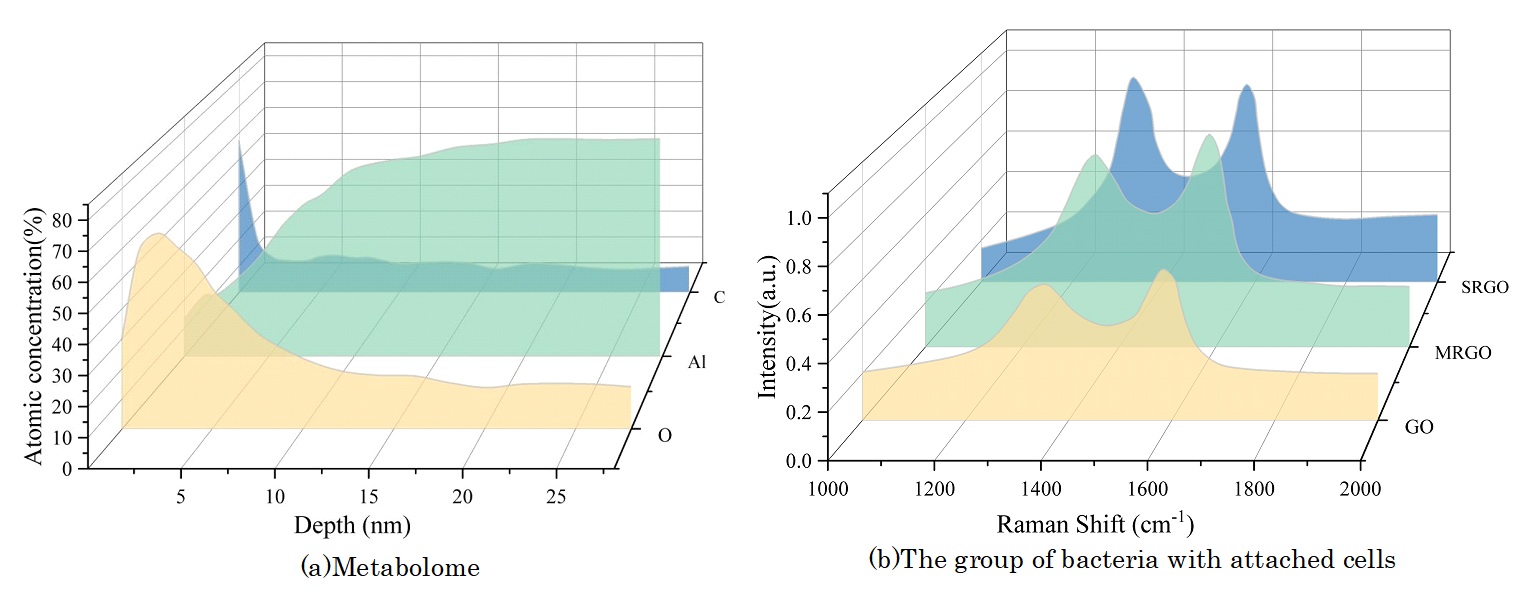
To further assess the effects of bacterial metabolic activity and cell adhesion on the thickness of the oxide film on the coating surface, AES sputtering analysis was performed on the surfaces of coating samples immersed under two different conditions for seven days. The depth distribution of major elements with sputtering depth is shown in Figure 3(a–b), primarily including the depth distribution curves of O, Al, and C elements. The depth distribution patterns of major elements on the surfaces of coating samples under different immersion conditions are similar. As the sputtering depth increases, the atomic concentration of O initially increases rapidly to a maximum value, then continues to decrease until it reaches the aluminum substrate interface, after which it begins to stabilize. The atomic concentration of Al increases overall with increasing sputtering depth until it reaches the vicinity of the aluminum substrate, after which it begins to stabilize at a basic level. The atomic concentration of C decreases continuously from the start of sputtering until it stabilizes at a low level.
The sputtering depth at which the atomic concentration of oxygen is reduced to half of the surface value of the sample is typically assessed as the thickness of the oxide film. Based on the above method, the average thickness of the surface oxide film in the metabolite group samples was determined to be approximately 9.734 nm, while the average thickness of the surface oxide film in the bacterial group samples with attached cells decreased to approximately 7.256 nm. AES data from the coating surface under different immersion conditions indicate that the acidic metabolites produced by SRB and the SRB cells attached to the surface cause the oxide film on the coating surface to thin.
The above AES analysis results indicate that SRB promotes the thinning of the oxide film on the coating surface by producing acidic metabolites and cell adhesion in the condensate simulation fluid. This will affect the distribution and integrity of the oxide film, thereby affecting the protective performance of the oxide film on the aluminum substrate.
3.3 Analysis of electrochemical behavior
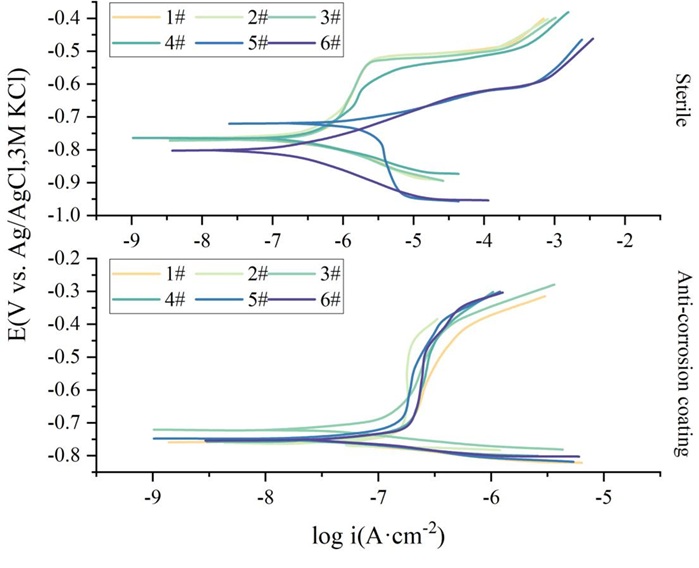
To characterize the electrochemical corrosion behavior of the system, EIS was employed for characterization. The electrode farthest from the opening of the peeled coating (innermost) is designated as Electrode 1, with the remaining electrodes numbered sequentially. The electrode outside the peeled coating (outermost) is designated as Electrode 6.
The smaller the R\({}_{ct}\) or R\({}_{p}\) value, the larger the cathodic current of the reaction, which leads to increased coating adsorption. Based on the EIS results, it was found that the coating in the system increases the cathodic reaction resistance and slows down the cathodic reaction. This is because the Fe\(^{2+}\) generated by corrosion combines with the S\(^{2-}\) produced by the coating to form FeS, which deposits on the electrode surface, forming a relatively dense corrosion product film that inhibits the cathodic reaction of the steel substrate. The addition of CP accelerates the cathodic reaction at different locations of the steel, and the more negative the CP potential, the more pronounced this acceleration becomes.
To characterize the corrosion rate of the system, dynamic polarization was employed. The dynamic polarization curves for different groups are shown in Figure 4, and the fitting results of the polarization curves are presented in Table 1. Due to passivation phenomena in the anodic branches of some electrodes, the cathodic branches were selected for fitting. The coating group formed a FeS protective film, resulting in a smaller corrosion current compared to the sterile condition. The i\({}_{corr}\) values of electrodes 1–5 with the coating removed ranged from 0.038 to 0.193 \(\mu\)A·cm\(^{-2}\), while the i\({}_{corr}\) value of electrode 6 with the coating removed was significantly lower than that of the sterile electrode 6, at 0.038 \(\mu\)A·cm\(^{-2}\), demonstrating that the introduction of the corrosion-resistant coating in the system has a certain protective effect.
| Electrode | E\({}_{corr}\)(mV) | i\({}_{corr}\)(\(\mu\)A·cm\({}^{-2}\)) | b\({}_{c}\)(mV·dec\({}^{-1}\)) | |
|---|---|---|---|---|
| Sterile | 1# | -797 | 0.397 | -91.186 |
| 2# | -784 | 0.359 | -90.373 | |
| 3# | -808 | 0.304 | -84.416 | |
| 4# | -799 | 0.106 | -70.362 | |
| 5# | -745 | 0.455 | -96.017 | |
| 6# | -834 | 1.118 | -72.118 | |
| Anti-corrosion coating | 1# | -776 | 0.193 | -35.028 |
| 2# | -780 | 0.125 | -20.375 | |
| 3# | -723 | 0.048 | -36.196 | |
| 4# | -761 | 0.042 | -32.915 | |
| 5# | -755 | 0.039 | -59.371 | |
| 6# | -759 | 0.038 | -80.037 | |
3.4 Research on corrosion resistance mechanisms
3.4.1 Reduction of GO by SRB
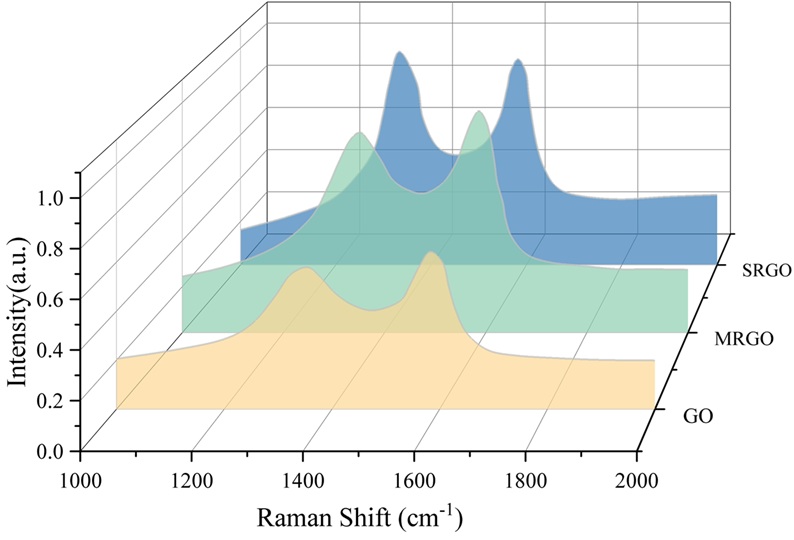
Raman scattering is a tool for characterizing the disordered nature of carbon materials and was used in this study to monitor the reduction process of GO. The Raman spectra of different samples are shown in Figure 5. GO primarily exhibits two distinct characteristic peaks, known as the D peak and G peak. After reduction, the D peaks of MRGO and SRGO shift to 1366 cm\(^{-1}\) and 1351 cm\(^{-1}\), respectively, while the G peaks shift to 1615 cm\(^{-1}\) and 1603 cm\(^{-1}\), respectively, all of which are lower than the peak positions of GO, indicating the reduction process. The degree of structural disorder is characterized by the ratio of the intensities of the D peak to the G peak. The I\({}_{D}\)/I\({}_{G}\) value of GO is 0.93, while the I\({}_{D}\)/I\({}_{G}\) values of MRGO and BRGO gradually increase to 0.96 and 1.15, respectively, after reduction. After reduction, a large number of sp³-hybridized carbon atoms in GO lose their oxygen-containing groups to form sp\(^{2}\)-hybridized carbon atoms. However, the newly formed sp\(^{2}\) regions are smaller in size than the sp³ regions in GO. This results in a smaller average sp\(^{2}\) region size in BRGO, increased fragmentation of GO, an increase in the number of fragments, and an increase in defect density, leading to an enhanced I\({}_{D}\)/I\({}_{G}\) value.
3.4.2 Biofilm morphology
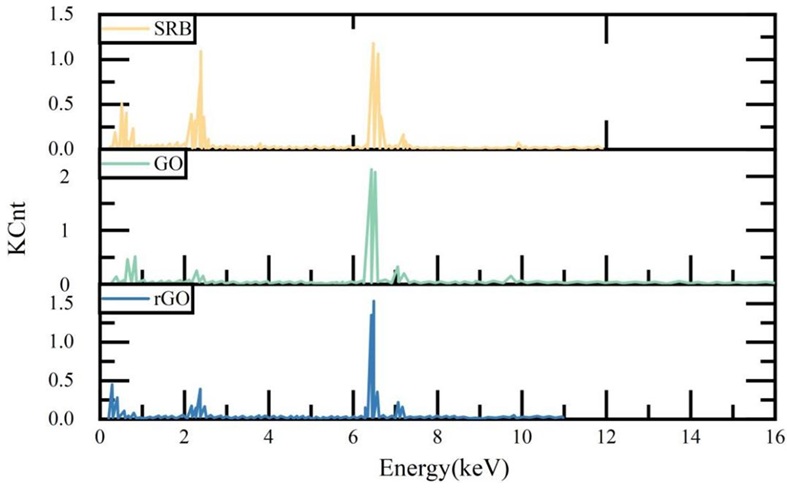
The EDS elemental analysis results of SRB biofilms and corrosion products on the sample surface under different conditions are shown in Figure 6. When only SRB is present, the sulfur (S) content in the corrosion products is the highest, reaching 8.95%, which is produced by SRB metabolism. After adding GO and rGO, the S element content in the characteristic corrosion products of SRB decreases significantly, to 2.42% and 3.16%, respectively, indicating that SRB metabolic activity is inhibited. The content of elements such as C and N also decreased, which is related to the reduction in biofilm. However, the C content significantly increased, primarily due to the coverage of rGO. These results indicate that the addition of GO and rGO can reduce the content of SRB-specific corrosion products, inhibit their growth, and reduce the adhesion of biofilms on carbon steel surfaces.
3.4.3 Pitting distribution
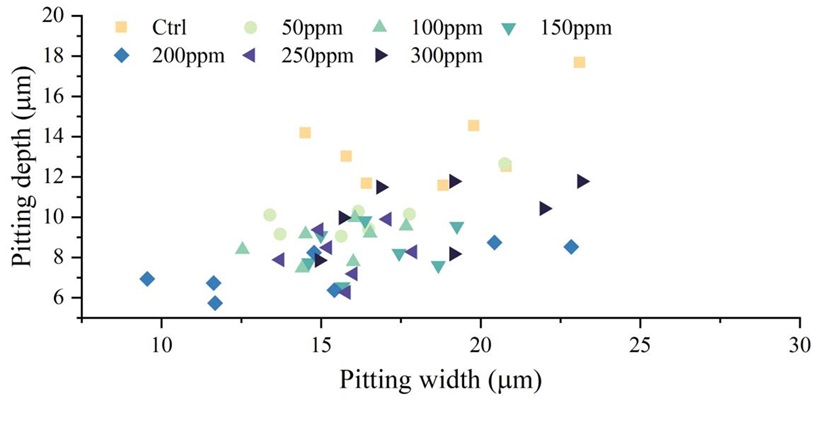
After adding rGO at different concentration gradients, the depth and width of seven pitting corrosion pits on the sample surface were measured, with the results shown in Figure 7. When only SRB was present, the depth and width of the pitting corrosion pits on the carbon steel surface were the largest, with a maximum depth of 17.7 \(\mu\)m and a maximum width of 23.1 \(\mu\)m, and the pitting corrosion pit depths were primarily concentrated between 11 and 14 mm. After adding different concentration gradients of GO, both the depth and width of the pitting corrosion pits on the carbon steel surface decreased, indicating that adding rGO can reduce the depth and width of the pitting corrosion pits caused by SRB on the carbon steel surface. The effect of mitigating pitting corrosion is related to the amount of rGO added. When the rGO addition was 200 ppm, the effect was optimal, with a maximum pitting corrosion pit depth of 8.5 mm and a width of 22.8 mm.
3.4.4 Uniform corrosion rate
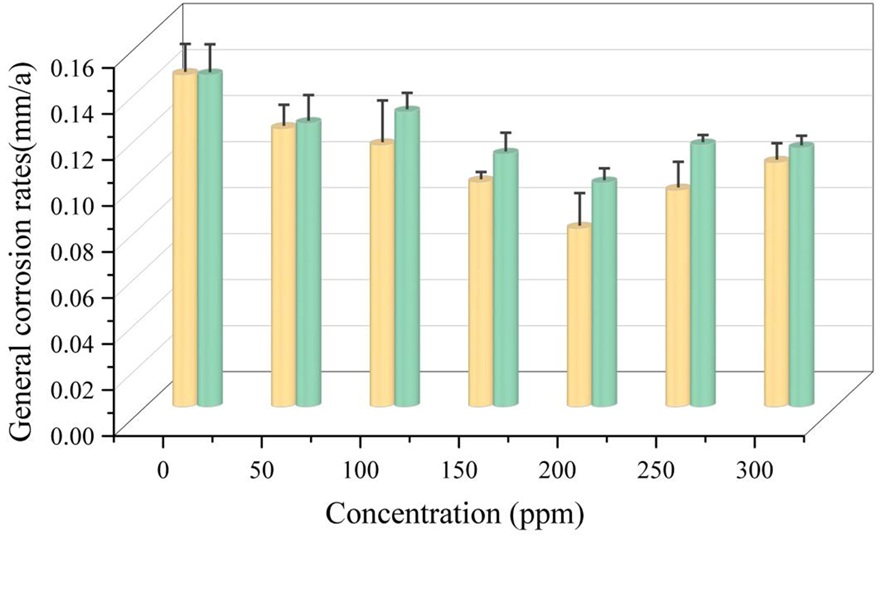
The uniform corrosion rates of the specimens in the SRB medium under different conditions are shown in Figure 8. When only SRB is present, the uniform corrosion rate of carbon steel is the highest, at 0.144 mm/a. After adding GO and rGO, the uniform corrosion rates of carbon steel gradually decrease. When the addition levels of GO and rGO were both 200 ppm, the uniform corrosion rate of carbon steel was the lowest, at 0.078 mm/a and 0.097 mm/a, respectively, indicating that GO and rGO can mitigate SRB corrosion on carbon steel, consistent with the pitting corrosion data results. However, when the addition levels of GO and rGO exceeded 200 ppm, the uniform corrosion rate increased with increasing addition levels.
4 Conclusion
This study focuses on SRB to evaluate the microbial corrosion resistance performance of anti-corrosion coatings in ship ballast water tanks and to analyze the corrosion mechanism of SRB.
The total concentration of various organic acids produced by SRB cells in the condensate water simulation solution exceeds 500 mg/L. The production of organic acids by bacterial metabolism is the direct cause of the decrease in pH value of the bacterial culture medium. The DOC values of sterile condensation water simulation solution and bacterial metabolite solution are basically the same. The DOC value of condensation water simulation solution inoculated with SRB is only 2.204 ppm, indicating that SRB cell respiration affects the DOC of the solution. Bacterial respiration consumes oxygen, leading to a decrease in the DOC value of the solution.
The coating forms a FeS protective film, resulting in lower corrosion current compared to sterile conditions. The i\({}_{corr}\) values of electrodes 1–5 inside the peeled coating range from 0.038 to 0.193 \(\mu\)A·cm\(^{-2}\), while the i\({}_{corr}\) value of electrode 6 outside the peeled coating is significantly lower than that of the sterile electrode 6, at 0.038 \(\mu\)A·cm\(^{-2}\), demonstrating that the introduction of the corrosion-resistant coating provides some protective effect.
When the addition of rGO is 200 ppm, the effect is optimal, with a maximum pitting depth of 8.5 mm and a width of 22.8 mm. When both GO and rGO are added at 200 ppm, the uniform corrosion rate of carbon steel is minimal, at 0.078 mm/a and 0.097 mm/a, respectively.